美國線上財經網站DailyFinance報導,華爾街許多名嘴都是靠預測重大事件而聲名大噪,但根據最新的研究結果顯示,名嘴不等於預測精準度,包括「新末日博士」盧比尼(Nouriel Roubini)與「華爾街天后」惠特妮(Meredith Whitney)在市場預測上經常看走眼。
報導指出,華爾街有些專家因精確預測某一重大事件而竄紅,甚至被奉為投資名嘴,經常針對股市、債市與房市發表評論與預測。但是針對這些名嘴提供的專業意見,投資人聽聽就好,不要盲目追隨,不然損失的是投資人自己的荷包。
根據《波士頓環球報》所做的調查發現,許多因大膽預測重大事件而被譽為先知的分析師,其實在預測準確度上普遍都偏低,有些甚至可能就只準過那麼一次。
華爾街這類名嘴還不少,專攻銀行業分析的惠特妮曾贏得華爾街天后的美名,她是少數幾個能預先看到金融危機的專家,但在市場預測上她的命中率偏低,根據彭博的資料,到去年年中她發表的股市預測中僅6個命中,失準的有13個,甚至在她的強項金融股部份也出現高失誤,標普5百金融類股的81檔個股股價預測上,她的命中率僅37%。
因預測金融風暴與美國經濟衰退而聞名國際的紐約大學教授盧比尼,近幾年在市場預測上同樣失誤連連,包括他曾斷言2009年油價持續低迷,每桶不會超過40美元,但該年底油價飆至80美元,以及2009年3月他說標普5百指數會跌破600點,但該年底美股大盤收盤指數達1,115點,全年飆漲23.5%。
前美林明星分析師羅森伯格(David Rosenberg)也是早早就發覺金融危機的預兆,但之後始終看空美國經濟復甦,與實際情況相反。羅森伯格目前為Gluskin Scheff首席經濟學家。
Europacific分析師席夫(Peter Schiff)因準確預測金融危機而一砲而紅,但對美國經濟復甦卻是完全看走眼,儘管事實已擺在眼前,他至今還堅稱經濟狀況比2008年還糟,甚至瀕臨蕭條。
source: http://news.chinatimes.com/world/11050401/122011012000219.html
2011年1月20日 星期四

2011年1月18日 星期二
混合型基金鼻祖—惠靈頓基金
1815年,惠靈頓公爵(Duke of Wellington)在滑鐵盧依靠優勢兵力打敗拿破侖,成為英國歷史上最為著名的軍事家,后任英國第25、27任首相,也是世界上唯一一位獲得7國元帥軍銜者。1935年7月11日,當沃特·L·摩根打算給規模已超過50萬美元的基金換一個更響亮的名字時,作為“鐵公爵”的崇拜者,他選擇了惠靈頓這個名字。惠靈頓基金,是世界上第一只將資產分散投資於股票、債券的混合型基金,至今仍是世界上最為著名、規模最大的混合型基金之一。
作為普林斯頓大學的高材生,沃特·L·摩根在1925年創立了自己的會計師事務所,并隨即將業務從稅務咨詢拓展到為客戶提供投資咨詢服務。摩根對於資產管理興趣越來越濃厚,并開始考慮通過集中管理多個個人資產,實現規模投資效應。他以敏銳的嗅覺意識到,投資者需要的是分散化投資、組合管理、便利而不是復雜性,相信共同基金將會是一個很好的商業契機。
1928年7月1日,電力證券公司(Power Securities Company)正式成立,初始資金為10萬美元,這就是惠靈頓基金的前身。與當時其他8只開放式基金將資金全部投資於股票有所不同,該公司是第一個打破慣例把資金投資在股票與債券上的共同管理基金。摩根將60%~70%的資產投資於各類普通股票和優選股,而將30%~40%資產投資於債券或現金等固定收益工具。
雖然,平衡型基金開創了一種全新的投資風格,但是,“咆哮的二十年代”顯然不是平衡型基金受歡迎的時代。不過,摩根依然堅持著自己均衡的投資風格,堅持在債券及現金上的資產配置。組合報告顯示,1929年8月摩根就開始降低組合中普通股票的持倉比例,到了9月初,其股票倉位從7月底的8成迅速降低至4成,他還在組合中保留了4成的現金,保證投資組合擁有充分的流動性。1929年10月,紐約爆發了歷史上最為嚴重的股市崩盤,該公司是為數不多損失較小的基金之一。穩健的風格贏得了市場的逐漸認可,到了1929年底,規模增長到19.5萬美元。
直到1935年,摩根將其更名為惠靈頓基金(Wellington Fund)并於1958年,成為由摩根一手培養的基金行業傳奇人物約翰·博格爾創立的先鋒基金家族中一員。
經歷了二戰和大蕭條,1960年代,惠靈頓基金逐漸演變為一只價值導向型基金。1974年,約翰·博格爾創立了先鋒集團,惠靈頓基金正式更名為先鋒惠靈頓基金,博格爾進行的一系列改革進一步提高了基金的管理效率并降低了費用,惠靈頓基金開始尋求包括中國在內的全球化投資機會。
目前,惠靈頓基金已成為規模最大的平衡型基金,截至2010年10月6日,惠靈頓基金規模達到505.4億美元。持有超過100只股票和400只各類債券,入選2009年福布斯雜志最值得購買基金榜。
截至2009年3月31日,先鋒惠靈頓基金近40年年均回報達到9.15%。
source: http://news.cnyes.com/Content/20110117/KDUG0KPRL1J7A.shtml
作為普林斯頓大學的高材生,沃特·L·摩根在1925年創立了自己的會計師事務所,并隨即將業務從稅務咨詢拓展到為客戶提供投資咨詢服務。摩根對於資產管理興趣越來越濃厚,并開始考慮通過集中管理多個個人資產,實現規模投資效應。他以敏銳的嗅覺意識到,投資者需要的是分散化投資、組合管理、便利而不是復雜性,相信共同基金將會是一個很好的商業契機。
1928年7月1日,電力證券公司(Power Securities Company)正式成立,初始資金為10萬美元,這就是惠靈頓基金的前身。與當時其他8只開放式基金將資金全部投資於股票有所不同,該公司是第一個打破慣例把資金投資在股票與債券上的共同管理基金。摩根將60%~70%的資產投資於各類普通股票和優選股,而將30%~40%資產投資於債券或現金等固定收益工具。
雖然,平衡型基金開創了一種全新的投資風格,但是,“咆哮的二十年代”顯然不是平衡型基金受歡迎的時代。不過,摩根依然堅持著自己均衡的投資風格,堅持在債券及現金上的資產配置。組合報告顯示,1929年8月摩根就開始降低組合中普通股票的持倉比例,到了9月初,其股票倉位從7月底的8成迅速降低至4成,他還在組合中保留了4成的現金,保證投資組合擁有充分的流動性。1929年10月,紐約爆發了歷史上最為嚴重的股市崩盤,該公司是為數不多損失較小的基金之一。穩健的風格贏得了市場的逐漸認可,到了1929年底,規模增長到19.5萬美元。
直到1935年,摩根將其更名為惠靈頓基金(Wellington Fund)并於1958年,成為由摩根一手培養的基金行業傳奇人物約翰·博格爾創立的先鋒基金家族中一員。
經歷了二戰和大蕭條,1960年代,惠靈頓基金逐漸演變為一只價值導向型基金。1974年,約翰·博格爾創立了先鋒集團,惠靈頓基金正式更名為先鋒惠靈頓基金,博格爾進行的一系列改革進一步提高了基金的管理效率并降低了費用,惠靈頓基金開始尋求包括中國在內的全球化投資機會。
目前,惠靈頓基金已成為規模最大的平衡型基金,截至2010年10月6日,惠靈頓基金規模達到505.4億美元。持有超過100只股票和400只各類債券,入選2009年福布斯雜志最值得購買基金榜。
截至2009年3月31日,先鋒惠靈頓基金近40年年均回報達到9.15%。
source: http://news.cnyes.com/Content/20110117/KDUG0KPRL1J7A.shtml
2011年1月4日 星期二
10 ETF Trends Predictions for 2011
10 ETF Trends Predictions for 2011
Just like we did last year, it’s time again to go into the dark closet, get out the crystal ball, dust it off and look inside. What does the exchange traded fund (ETF) industry have in store for us for 2011? And more importantly, will we fare as well with our predictions as we did this year?
1. Small-caps will dust large-caps. Historically, small-caps have outperformed large-caps coming out of economic downturns. That’s been true so far this time around, too. We expect this trend to continue in 2011 as the economic recovery gathers steam.
2. Commodity demand will intensify. Continuing what they started in 2010, commodities will continue to be hot in 2011. A combination of a growing population, a rising emerging market middle class and investment demand will continue to support prices.
3. The Federal Reserve will hike interest rates. Okay, we predicted this one last year and we were a bit early. But this year, as the economy gets better, the Fed will raise rates. If you’re holding long-term bonds, be prepared to act when it happens.
4. The United States is where it’s at. The conventional wisdom has lately held that if you don’t have an allocation overseas, you’re missing something. While emerging markets turned flat in the fourth quarter, the United States gained a fair bit of strength in the last quarter of 2010 that we think will hold in the new year thanks to improving earnings, corporate cash and investor confidence in the domestic economy.
5. Tech ETFs and the NASDAQ will be stars. Once again, the NASDAQ is the year’s top-performing index, gaining 20% this year. But after jumping more than 53% in 2009, this year’s numbers look decidedly lackluster. In 2011, look for technology ETFs to become market stars once again, thanks to an explosion of personal devices and a resumption of corporate IT spending.
6. There will be a physically-backed ETF explosion. No longer content to offer physically-backed gold, silver, palladium and platinum ETFs, providers will launch a slew of other physical funds. Most hotly anticipated are the aluminum and copper funds, which are still in registration. We predict that they’ll get the go-ahead in the first quarter.
7. ETFs will get even cheaper. Though there will be an eventual bottom to both ETF expense ratios and trading commission costs, we’re not there yet. TD Ameritrade’s move to offer 100 ETFs commission-free is a first step – we predict we’ll see even more of the same in the coming year. And those price wars? Look out below for falling expense ratios!
8. Actively managed ETFs catch on. Active management has struggled to really catch on with investors. But one area of active management that proved its worth in 2010 was fixed-income. Having the flexibility to make portfolio adjustments as economic conditions change proved to be a valuable commodity this year, and we think investors will get wise to this and give active bond funds a boost. Active management first burst on the scene in April 2008, so we think investors will be looking them with a keen eye.
9. ETF critics will back off. This year, the Kauffman report, Bogan report and BusinessWeek’s article about commodity ETFs took the industry to task. Although there will be increased and welcome critical thinking when it comes to ETFs, we predict that people will finally get educated and stop being scared of them.
10. ETF assets will continue the uptrend and hit $1.5 trillion. ETF assets finally hit $1 trillion in late December. We predict that they’ll not only stay there, but they’ll build on that. A recent study showed that most investors don’t know what an ETF is; if they were able to hit $1 trillion with so few knowing, imagine the possibilities as more people learn.
Here’s to a great 2011!
Just like we did last year, it’s time again to go into the dark closet, get out the crystal ball, dust it off and look inside. What does the exchange traded fund (ETF) industry have in store for us for 2011? And more importantly, will we fare as well with our predictions as we did this year?
1. Small-caps will dust large-caps. Historically, small-caps have outperformed large-caps coming out of economic downturns. That’s been true so far this time around, too. We expect this trend to continue in 2011 as the economic recovery gathers steam.
2. Commodity demand will intensify. Continuing what they started in 2010, commodities will continue to be hot in 2011. A combination of a growing population, a rising emerging market middle class and investment demand will continue to support prices.
3. The Federal Reserve will hike interest rates. Okay, we predicted this one last year and we were a bit early. But this year, as the economy gets better, the Fed will raise rates. If you’re holding long-term bonds, be prepared to act when it happens.
4. The United States is where it’s at. The conventional wisdom has lately held that if you don’t have an allocation overseas, you’re missing something. While emerging markets turned flat in the fourth quarter, the United States gained a fair bit of strength in the last quarter of 2010 that we think will hold in the new year thanks to improving earnings, corporate cash and investor confidence in the domestic economy.
5. Tech ETFs and the NASDAQ will be stars. Once again, the NASDAQ is the year’s top-performing index, gaining 20% this year. But after jumping more than 53% in 2009, this year’s numbers look decidedly lackluster. In 2011, look for technology ETFs to become market stars once again, thanks to an explosion of personal devices and a resumption of corporate IT spending.
6. There will be a physically-backed ETF explosion. No longer content to offer physically-backed gold, silver, palladium and platinum ETFs, providers will launch a slew of other physical funds. Most hotly anticipated are the aluminum and copper funds, which are still in registration. We predict that they’ll get the go-ahead in the first quarter.
7. ETFs will get even cheaper. Though there will be an eventual bottom to both ETF expense ratios and trading commission costs, we’re not there yet. TD Ameritrade’s move to offer 100 ETFs commission-free is a first step – we predict we’ll see even more of the same in the coming year. And those price wars? Look out below for falling expense ratios!
8. Actively managed ETFs catch on. Active management has struggled to really catch on with investors. But one area of active management that proved its worth in 2010 was fixed-income. Having the flexibility to make portfolio adjustments as economic conditions change proved to be a valuable commodity this year, and we think investors will get wise to this and give active bond funds a boost. Active management first burst on the scene in April 2008, so we think investors will be looking them with a keen eye.
9. ETF critics will back off. This year, the Kauffman report, Bogan report and BusinessWeek’s article about commodity ETFs took the industry to task. Although there will be increased and welcome critical thinking when it comes to ETFs, we predict that people will finally get educated and stop being scared of them.
10. ETF assets will continue the uptrend and hit $1.5 trillion. ETF assets finally hit $1 trillion in late December. We predict that they’ll not only stay there, but they’ll build on that. A recent study showed that most investors don’t know what an ETF is; if they were able to hit $1 trillion with so few knowing, imagine the possibilities as more people learn.
Here’s to a great 2011!
2010年9月20日 星期一
Its Official: Recession Ended June 2009
From the B.I.G.
The NBER has officially dated the end of the Great Recession June 2009:
The Business Cycle Dating Committee of the National Bureau of Economic Research met yesterday by conference call. At its meeting, the committee determined that a trough in business activity occurred in the U.S. economy in June 2009. The trough marks the end of the recession that began in December 2007 and the beginning of an expansion. The recession lasted 18 months, which makes it the longest of any recession since World War II. Previously the longest postwar recessions were those of 1973-75 and 1981-82, both of which lasted 16 months.
In determining that a trough occurred in June 2009, the committee did not conclude that economic conditions since that month have been favorable or that the economy has returned to operating at normal capacity. Rather, the committee determined only that the recession ended and a recovery began in that month. A recession is a period of falling economic activity spread across the economy, lasting more than a few months, normally visible in real GDP, real income, employment, industrial production, and wholesale-retail sales. The trough marks the end of the declining phase and the start of the rising phase of the business cycle. Economic activity is typically below normal in the early stages of an expansion, and it sometimes remains so well into the expansion.
The committee decided that any future downturn of the economy would be a new recession and not a continuation of the recession that began in December 2007. The basis for this decision was the length and strength of the recovery to date. .......(This report is also available as a PDF file)
Real GDP
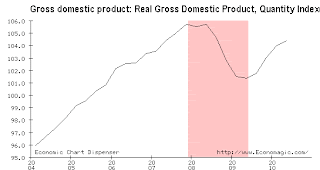
Industrial Production

Real Income

Retail sales

Employment (NFP)

Note the last chart — NFP — it goes back to 2000 instead of 2004. The NBER may have jumped the gun when they declared the recession over in November 2001; Employment did not bottom for another 2 full years!
The charts are from the nice folk at Economagic, who need to adjust their recession dating.
Source:
NBER Business Cycle Dating Committee Announces Trough Date
Business Cycle Dating Committee
National Bureau of Economic Research, September 20, 2010
http://www.nber.org/cycles/sept2010.html
The NBER has officially dated the end of the Great Recession June 2009:
The Business Cycle Dating Committee of the National Bureau of Economic Research met yesterday by conference call. At its meeting, the committee determined that a trough in business activity occurred in the U.S. economy in June 2009. The trough marks the end of the recession that began in December 2007 and the beginning of an expansion. The recession lasted 18 months, which makes it the longest of any recession since World War II. Previously the longest postwar recessions were those of 1973-75 and 1981-82, both of which lasted 16 months.
In determining that a trough occurred in June 2009, the committee did not conclude that economic conditions since that month have been favorable or that the economy has returned to operating at normal capacity. Rather, the committee determined only that the recession ended and a recovery began in that month. A recession is a period of falling economic activity spread across the economy, lasting more than a few months, normally visible in real GDP, real income, employment, industrial production, and wholesale-retail sales. The trough marks the end of the declining phase and the start of the rising phase of the business cycle. Economic activity is typically below normal in the early stages of an expansion, and it sometimes remains so well into the expansion.
The committee decided that any future downturn of the economy would be a new recession and not a continuation of the recession that began in December 2007. The basis for this decision was the length and strength of the recovery to date. .......(This report is also available as a PDF file)
Real GDP

Industrial Production

Real Income

Retail sales

Employment (NFP)

Note the last chart — NFP — it goes back to 2000 instead of 2004. The NBER may have jumped the gun when they declared the recession over in November 2001; Employment did not bottom for another 2 full years!
The charts are from the nice folk at Economagic, who need to adjust their recession dating.
Source:
NBER Business Cycle Dating Committee Announces Trough Date
Business Cycle Dating Committee
National Bureau of Economic Research, September 20, 2010
http://www.nber.org/cycles/sept2010.html
2010年9月9日 星期四
致富會所/正面思考 路更寬
從小到大當我們遇到各式各樣的難處,肯定有人安慰過你「塞翁失馬,焉知非福」。任何事都有一體兩面,只是往往身在其中看不清;工作生活遇到不如意時,常身不由己地陷入負面思考的惡性循環。這就是人性。
如果自己不夠正面,上帝還給我們安排了朋友,選擇樂觀的朋友,在我們悲觀的時候可以拉自己一把。正面的朋友像太陽,所到之處永遠是溫暖光亮;負面的人像月亮,陰晴圓缺不一樣。
最近看到一篇小故事,說到有位秀才第三次進京趕考,住在一個經常住的店裏。考試前兩天他做了三個夢, 第一個夢是自己在牆上種白菜;第二個夢是下雨天,他戴了斗笠還打傘;第三個夢是跟心愛的表妹脫光了衣服躺在一起,但是背靠著背。
這三個夢似乎有些深意,秀才第二天就趕緊去找算命的解夢。算命的一聽,連拍大腿 說:「你還是回家吧!你想想,高牆上種菜不是白費勁嗎?戴斗笠打雨傘不是多此一舉嗎?跟表妹都脫光了躺在一張床上了,卻背靠背,不是沒戲嗎?」秀才一聽,心灰意冷,回店收拾包袱準備回家。
店老闆覺得非常奇怪,問:「不是明天才考試嗎,怎麼你今天就回鄉了?」秀才如此這般說了一番,店老闆樂了:「喲,我也會解夢的。我倒覺得,你這次一定要留下來。你想想,牆上種菜不是高種嗎?戴斗笠打傘不是說明你這次有備無患嗎?跟你表妹脫光了背靠靠躺在床上,不是說明你翻身的時候就要到了嗎?」
秀才一聽,更有道理,於是精神振奮地參加考試,結果當然高中。
秀才碰到了不同的人,得到了不同的人對現實不同的解釋,也跟著產生了不同的思考及行為模式。這兩個人對於夢境兩面的解釋,分開來看你不覺得都很有道理嗎? 正負的想法不就在一念之間嗎?
在非常低潮的時候,實際情況也許沒有這麼快就能轉換,但是你的正面思考能力,不就在負面的隔壁嗎?換個角度,再堅持一會,讓自己能夠跳開消極的態度一下子,找個像太陽的朋友,感受他們正面的解讀,也許你也能跟秀才一樣,讓自己的負面情緒奇妙地瞬間轉換,結果或許不一定跟他一樣順利,但是在過程中能夠有較正面思考,也挺划得來的,不是嗎?
想法決定我們的生活,有什麼樣的想法,就有什麼樣的生活質量。常看到身邊不是很富裕的朋友,他們隨遇而安,在任何處境下都不浪費能夠開心的生活點滴;也有相對很富足的朋友,他們努力工作,總是要等到賺到多少錢再帶父母去旅遊,做到某個程度就能有多點時間陪孩子一起讀書,升到某個職位才能思考自己要的人生…。
(source:經濟日報)
如果自己不夠正面,上帝還給我們安排了朋友,選擇樂觀的朋友,在我們悲觀的時候可以拉自己一把。正面的朋友像太陽,所到之處永遠是溫暖光亮;負面的人像月亮,陰晴圓缺不一樣。
最近看到一篇小故事,說到有位秀才第三次進京趕考,住在一個經常住的店裏。考試前兩天他做了三個夢, 第一個夢是自己在牆上種白菜;第二個夢是下雨天,他戴了斗笠還打傘;第三個夢是跟心愛的表妹脫光了衣服躺在一起,但是背靠著背。
這三個夢似乎有些深意,秀才第二天就趕緊去找算命的解夢。算命的一聽,連拍大腿 說:「你還是回家吧!你想想,高牆上種菜不是白費勁嗎?戴斗笠打雨傘不是多此一舉嗎?跟表妹都脫光了躺在一張床上了,卻背靠背,不是沒戲嗎?」秀才一聽,心灰意冷,回店收拾包袱準備回家。
店老闆覺得非常奇怪,問:「不是明天才考試嗎,怎麼你今天就回鄉了?」秀才如此這般說了一番,店老闆樂了:「喲,我也會解夢的。我倒覺得,你這次一定要留下來。你想想,牆上種菜不是高種嗎?戴斗笠打傘不是說明你這次有備無患嗎?跟你表妹脫光了背靠靠躺在床上,不是說明你翻身的時候就要到了嗎?」
秀才一聽,更有道理,於是精神振奮地參加考試,結果當然高中。
秀才碰到了不同的人,得到了不同的人對現實不同的解釋,也跟著產生了不同的思考及行為模式。這兩個人對於夢境兩面的解釋,分開來看你不覺得都很有道理嗎? 正負的想法不就在一念之間嗎?
在非常低潮的時候,實際情況也許沒有這麼快就能轉換,但是你的正面思考能力,不就在負面的隔壁嗎?換個角度,再堅持一會,讓自己能夠跳開消極的態度一下子,找個像太陽的朋友,感受他們正面的解讀,也許你也能跟秀才一樣,讓自己的負面情緒奇妙地瞬間轉換,結果或許不一定跟他一樣順利,但是在過程中能夠有較正面思考,也挺划得來的,不是嗎?
想法決定我們的生活,有什麼樣的想法,就有什麼樣的生活質量。常看到身邊不是很富裕的朋友,他們隨遇而安,在任何處境下都不浪費能夠開心的生活點滴;也有相對很富足的朋友,他們努力工作,總是要等到賺到多少錢再帶父母去旅遊,做到某個程度就能有多點時間陪孩子一起讀書,升到某個職位才能思考自己要的人生…。
(source:經濟日報)
2010年8月31日 星期二
新興複合字 點出投資熱區
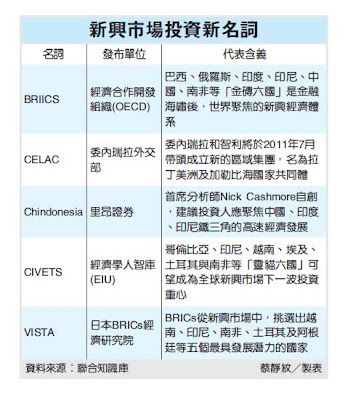
新興市場投資是近幾年來投資顯學,許多新創的複合字充斥各大研究報告或報導,最近像CIVETS(靈貓六國)、VISTA等,投資人不得不認識,才能找對速配工具下手。綜合各新興複合字,最受各研究機構推崇的新興國家首推印度、印尼、巴西三雄。
新興市場複合字的鼻祖,首推美商高盛經濟學家在2002年提出的BRICs(金磚四國),指巴西、俄羅斯、印度及中國四國,他們有希望在幾十年內取代七大工業國,成為世界最大經濟體的國家,簡稱來自國家的英文國名開頭字母。
之後高盛又首創「Next-11(新鑽11國)」指墨西哥、印尼、奈及利亞、南韓、越南、土耳其、菲律賓、埃及、巴基斯坦、伊朗和孟加拉。
在金磚四國及新鑽11國在全球資本市場走紅後,現在又有幾個新投資概念正吸引投資人目光。這些新名詞的共同特點就是全與新興市場有關,其中印度及印尼最常雀屏中選,拉丁美洲的第一大經濟體-巴西也是強中之強。
經濟學人智庫(EIU)認為,2020年時,七大新興國家(E7)經濟成長率可望較七大工業國(G7)高出11%,屆時全球經濟成長重心將移轉至新興國家。在新興國家當中,EIU特別看好哥倫比亞、印尼、越南、埃及、土耳其與南非等靈貓六國。
委內瑞拉、智利將帶頭在2011年7月成立新的區域集團「拉丁美洲及加勒比海國家共同體」(Community of Latin American and Caribbean States,西班牙文字首縮寫為CELAC),成員包括美國和加拿大以外的所有美洲國家,預定有32個會員國,加強區域內貿易,建立多邊貿易體系。
日本BRICs經濟研究院團隊從新興市場國家中,挑選出越南、印尼、南非、土耳其及阿根廷五個國家,並依序組合該五國的英文第一個字母,稱之為VISTA。BRICs預估,未來50年內,VISTA五國的國民生產毛額總值將超越七大工業國,達268兆美元。(source: 經濟日報2010.8.31)
新興市場複合字的鼻祖,首推美商高盛經濟學家在2002年提出的BRICs(金磚四國),指巴西、俄羅斯、印度及中國四國,他們有希望在幾十年內取代七大工業國,成為世界最大經濟體的國家,簡稱來自國家的英文國名開頭字母。
之後高盛又首創「Next-11(新鑽11國)」指墨西哥、印尼、奈及利亞、南韓、越南、土耳其、菲律賓、埃及、巴基斯坦、伊朗和孟加拉。
在金磚四國及新鑽11國在全球資本市場走紅後,現在又有幾個新投資概念正吸引投資人目光。這些新名詞的共同特點就是全與新興市場有關,其中印度及印尼最常雀屏中選,拉丁美洲的第一大經濟體-巴西也是強中之強。
經濟學人智庫(EIU)認為,2020年時,七大新興國家(E7)經濟成長率可望較七大工業國(G7)高出11%,屆時全球經濟成長重心將移轉至新興國家。在新興國家當中,EIU特別看好哥倫比亞、印尼、越南、埃及、土耳其與南非等靈貓六國。
委內瑞拉、智利將帶頭在2011年7月成立新的區域集團「拉丁美洲及加勒比海國家共同體」(Community of Latin American and Caribbean States,西班牙文字首縮寫為CELAC),成員包括美國和加拿大以外的所有美洲國家,預定有32個會員國,加強區域內貿易,建立多邊貿易體系。
日本BRICs經濟研究院團隊從新興市場國家中,挑選出越南、印尼、南非、土耳其及阿根廷五個國家,並依序組合該五國的英文第一個字母,稱之為VISTA。BRICs預估,未來50年內,VISTA五國的國民生產毛額總值將超越七大工業國,達268兆美元。(source: 經濟日報2010.8.31)

2010年8月17日 星期二
The truth about risk
From Vanguard Investing Truth的這篇 The truth about risk, 談的是大家熟悉的報酬、風險及資產配置,但很特別的是其特過下圖之互動式的圖表,供投資者自由選擇自1926-2008年間,股、債和現金在不同比重下,報酬的分配情況,還可再透過右上角的選項將資料轉化為圖、表,確實是個很棒且實用的設計,讓投資者可明顯感在不同的投資工具下,報酬及風險的分配。

基本上要進行資產配置時,最首要知道的是在你想要的預期報酬下,你對於風險的忍受承度為何? 以及你投資的目的是什麼? 何時需要這筆錢?
因而當要建立一個屬於自己的投資組合時,需要先回答以下幾個問題:
1.投資目標是什麼? 是退休還是為了出國念書? 可投資的時間有多長? 當你有愈長的可投資時間,相對可以忍受較大的波動。此時股票部位就可以偏重些。
2.這樣的投資組合可以讓你晚上睡得好覺嗎? 為了避免被市場短期的劇烈波動嚇得無法安心入眠,確定你可以忍受的報酬波動程度,以利在股、債和現金中做好適當的配置。
3.是否把雞蛋放在同一個籃子裡? 透過不同的資產類別、市場、國家等,將投資做多角化分散。當然最簡單的方法就是透過共同基金。
最後一個很重要的事情,當然就是不能忘記再平衡(Rebalance),以確保不讓股、債和現金的部位偏離了原先所設定的方向。
-----
這些的概念也是我們在建立EDCA時所做的。
在EDCA中,於合理的預期報酬下,考量個人有限的時間,及有限的資本下,規劃出資本的投入及最長需等待的時間。因為清楚知道可能的報酬及最大損失,因而對於短期的波動不會恐慌想逃。透過共同基金的投資工具,達到多角化的資產配置。最後停利後的再平衡動作,將資金連本帶利再投入,讓資金達到長期資值的目的。
(the truth about risk 這篇文章資訊來自綠角網站)
(the truth about risk 這篇文章資訊來自綠角網站)
訂閱:
文章 (Atom)